Metrics
On the server side, Citrus uses Fugo to collect metrics and logs.
System Status
Section titled “System Status”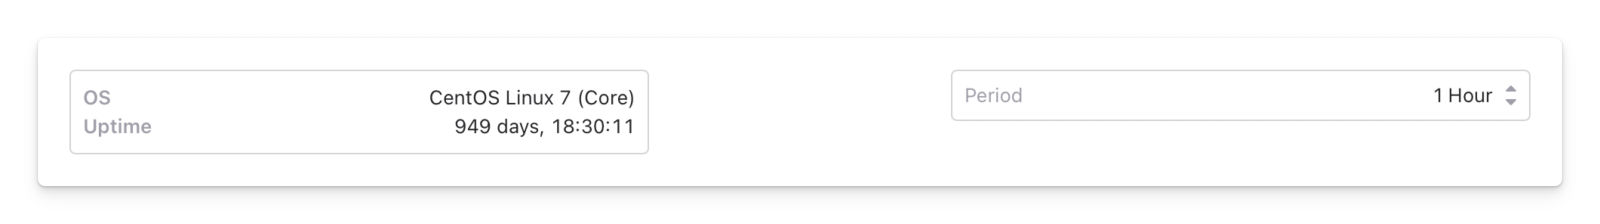
Here you can see the basic system status, including:
- Operating system version
- Uptime
Also, you can select the time range for the metrics: 1 hour or 24 hours.
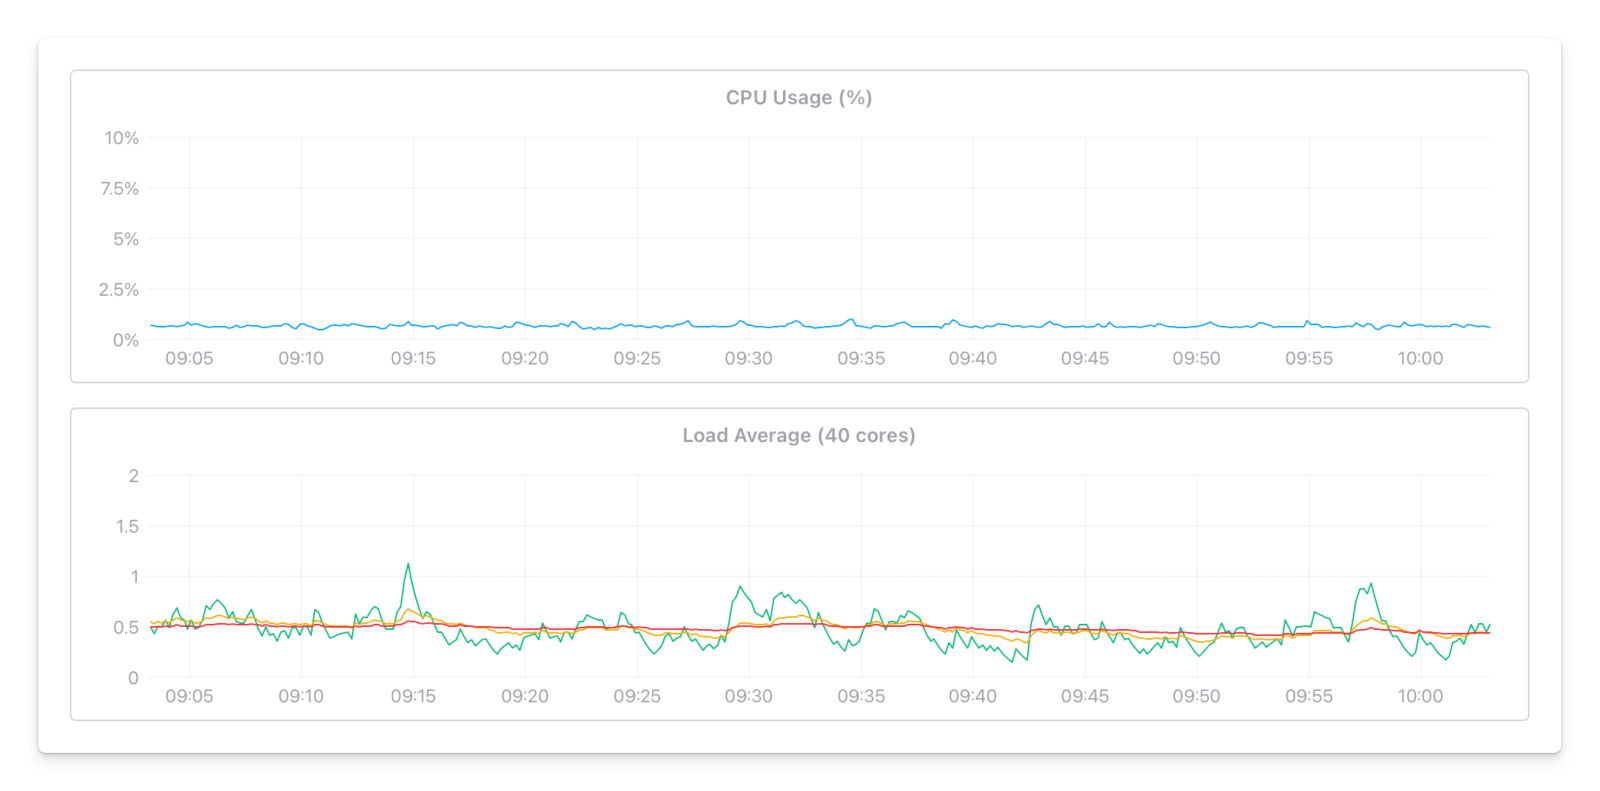
- CPU usage in percentage
- CPU load average for the last 1, 5, and 15 minutes
Memory
Section titled “Memory”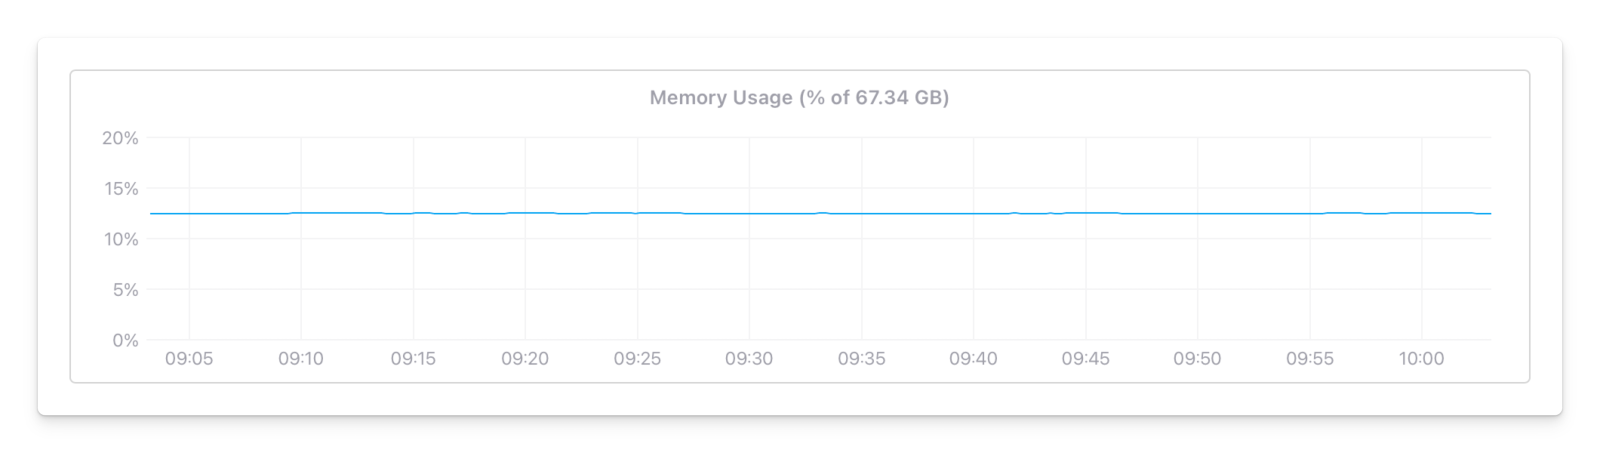
- Memory usage in percentage
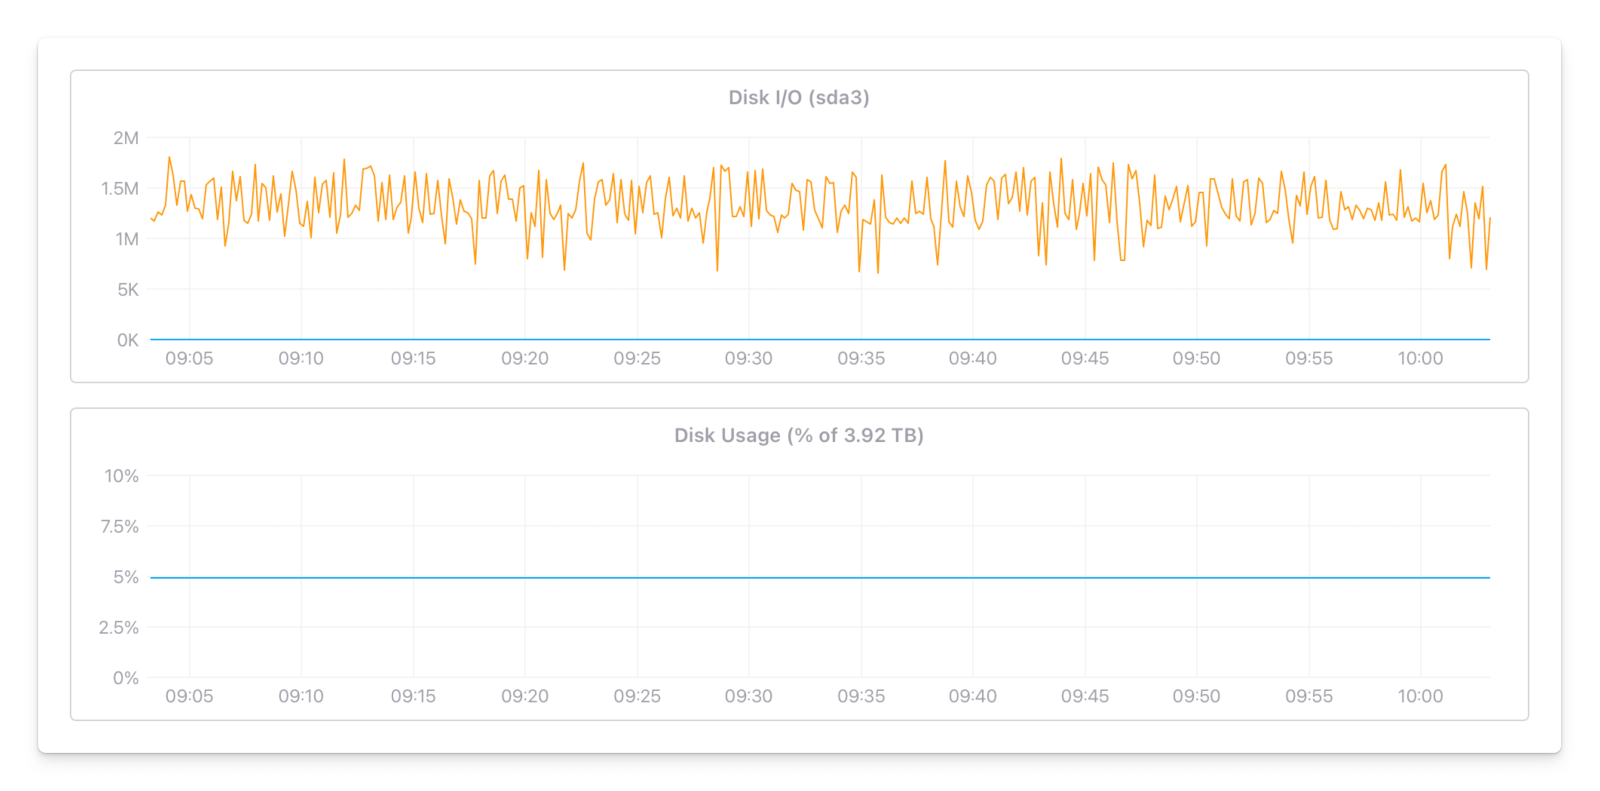
- Disk I/O operations in kilobytes per second
- Disk usage in percentage
- Disk total size in gigabytes you may find in the chart title
Network
Section titled “Network”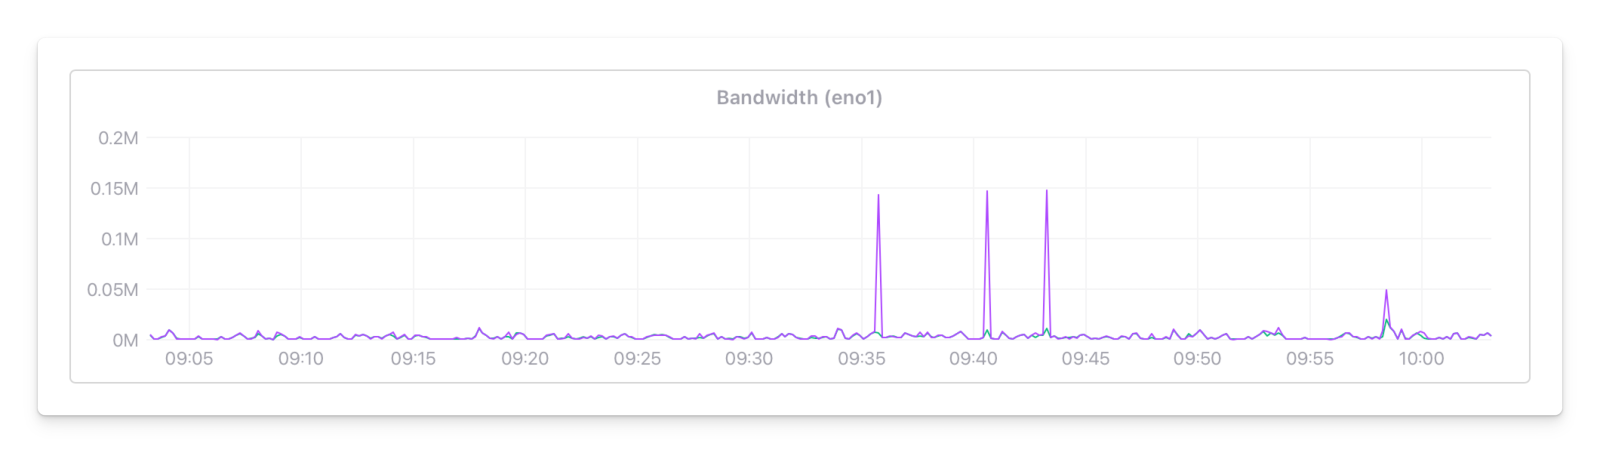
- Network I/O operations in kilobits per second